Surveys and Canvassing

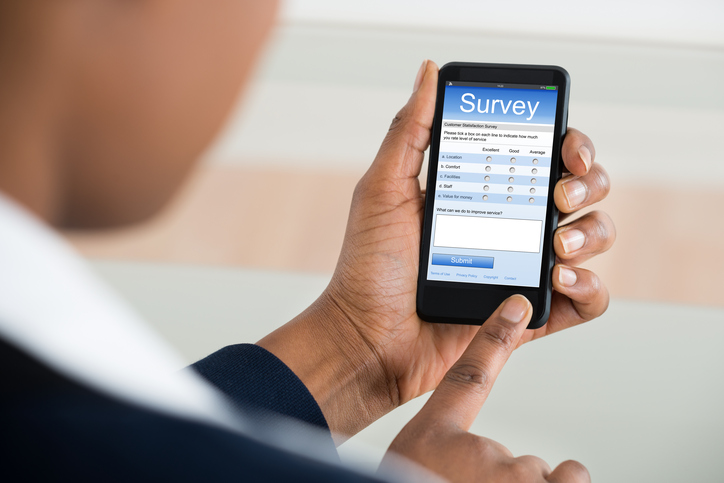
Mobile User friendly front end. After a customer interaction fill out the form as you go to net house in 10 to 30 seconds . No form books to carry no paper required.
Route tracking, Verify the route was followed and completed
Assignment. Custom middle ware to easily assign clients as required or receive an automatic notification that all assigned clients have been contacted.
Focused – Laser focus your mobile workers on the polling or marketing information you need. Support best practice and accountability
Training. System can be learnt in a few minutes and can be used on any mobile device.
Real time Information. Unique real time reporting capability allows you see the information as it is happening. The mobile app allows a mobile worker to complete and submit a report or form immediately after a customer interaction in 10 to 30 seconds . 5 seconds later the report is on the company server for review and analysis.
The Front Row survey system allows you to quickly create any survey . Simply use our handy “create survey” tool and select any questions you want answered. Send them to us and within 24hrs they will be available for your mobile workers to start entering surveys. In addition the Front Row app will hold a number of surveys allowing multiple information collection capability by any mobile worker.
The Front Row system provides both generic and custom reports to our clients. Below you will find 2 reports that will provide insight into your poll taker or marketing research rep performance and data.
In this report we are showing the Results for one rep from one week of surveying. Notice that you have the week broken down into 5 individual days. You can see the first and last call of each day, result and close ratio. The Results for one rep from one week of polling. You will be able to get this type of information for every rep in any time frame.
In report 2 we are comparing sales rep activity and sales amount since the start of the year. You will be able to view the activity levels of each rep and total sales by each rep. This will also allow you to obtain the average sales amount by rep. The selectable filters will allow you to change any date range, any region or district, or even individual reps. Never before has it been so easy to analyze your sales team and find your most productive reps.
There are thousands of reports that you can create using this reporting engine. We will work with you to design the perfect reports for your company. Remember each one of these reports can be turned into an excel spreadsheet for manipulation or hard copy.
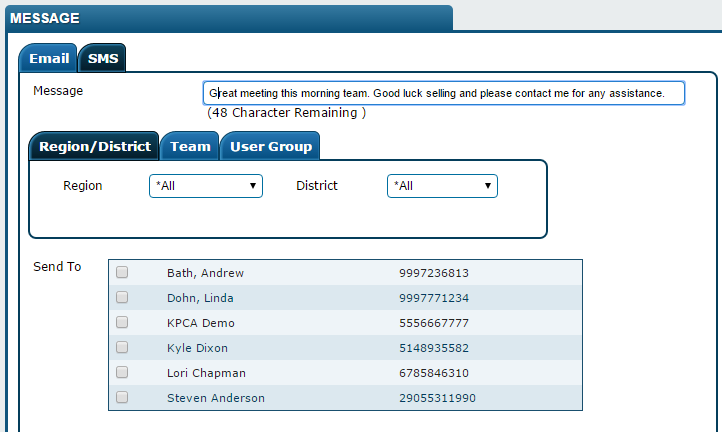
Every company can improve their communication system. Front Row provides a system that allows management to quickly and easily connect with their mobile workers. The Front Row message center allows the management team to send an email or text message out to the field. The texting component has a reported open rate of 98% in less than 5 minutes. This is a fantastic way of getting a message across to your field reps. Imagine being a manager using Front Row and seeing a report come in with fantastic results. The manager can use the message centre to immediately send a text back recognizing the successful polling results. Management can also send a text to all the field reps announcing a policy change or customer specific directives.

One of the key insights companies need is the number of times a client has been visited. If you believe in the 80/20 rule that 80 percent of your revenue is coming from 20 percent of your customers, then you better be sure that those key customers are being contacted the appropriate number of times.
In addition sales reps often lose track of the customers they have not visited. Both of these insights are critical for any company’s success.
In screen shot 1 we have selected a report to find what customers have not been visited this year. The report gives you the name of the clients, the rep responsible for that client and a selectable time frame for visits. The manager also has filters to narrow down the search base, Such as: Key Accounts, Account Type, Regions, Districts and rep. The “view” button allows you to see more information about the customer.
In screen shot 2 we have selected a report to identify those customers that have been visited more than 6 times since the start of the year, there are 79 customers. The manager also has filters to narrow down the search base; Such as Key Accounts, Account Type, Regions, Districts and rep. The “view” button allows you to see more information about the customer.


